


In Brief:
- Myria sells at $0.0007307 with a market cap of $22.26M on April 11, 2025.
- MYRIA’s price has fallen over the last 6 months by over 80%.
- Analysts predict a MYRIA bullish by the end of 2025 to over $0.00165.
As of April 11, MYRIA was valued at $0.0007307, with a market capitalization of $22.26M, with about 36K holders per Coinmarketcap data.
Myria is a blockchain gaming ecosystem designed as an Ethereum L2 scaling solution. The fully open-source and community-driven gaming studio allows gamers to own the MYRIA token and earn rewards playing AAA quality games. Myria end users can conveniently offer a seamless token experience at lower transaction cost, whether end users are developing dApps, minting new NFT collections, or trading existing tokens.
Also Read: Pangolin Crypto Price Prediction 2025, 2026, and 2030
In this article, we present our expert Myria crypto price prediction, written on April 11, 2025. We’ll also look at the short-term price analysis of MYRIA and other key technical indicators that can influence price.
Myria Crypto Price Prediction
Here’s an overview of our MYRIA price prediction for 2025, 2026, and 2030. Our predictions are based on current insights and trends, but please keep in mind that market conditions and unforeseen events can invalidate any forecast.
| Minimum MYRIA Price | Average MYRIA Price | Maximum MYRIA price | |
|---|---|---|---|
| 2025 | $0.000683 | $0.00154 | $0.00165 |
| 2026 | $0.00163 | $0.00184 | $0.00195 |
| 2030 | $0.00361 | $0.00381 | $0.00395 |
Myria Crypto Price Prediction 2025
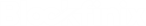
MYRIA lost a major support zone on the daily chart and has been declining since February 2025. We expect this downtrend may continue in the next few months, especially due to the general crypto bear market.
The 50/200-day Simple Moving Average (SMA) confirms the bearish trend for MYRIA. At the time of writing, the 200-day SMA was trending above the 50-day SMA, which indicates a bearish trend.
Our analysis is that Myria could see lower prices going into 2025. However, should the market factors improve, a potential 100% increase from the current price could see MYRIA’s price increase to a high of $0.00147, back into the key support zone.
DigitalCoinPrice shares a similar sentiment and predicts that Myria crypto will reach a high of $0.00165 in 2025. However, Gov Capital predicts that MYRIA could fall by over 54%, down to $0.00035 in the next six months.
Myria Crypto Price Prediction 2026
By 2026, we predict that Myria could reach a high of $0.00195 and a lowest price of $0.00163. Meanwhile, Coindataflow predicts that Myria could reach a high of $0.000743 and the lowest price of $0.000226.
Myria Crypto Price Prediction 2030
By 2030, Myria crypto could reach a high of $0.00395 and a low price of $0.00361, as the crypto market improves. However, Coindataflow foresees a more conservative high of $0.001437 and a minimum of $0.000459.
Short-term Myria Crypto Price Prediction
Myria is simply bearish as of April 11. The price has been in a freefall since late January as the rest of the market unwound from the rally fueled by Donald Trump’s election victory.
So far this month, Myria has lost nearly 5% of its value and more than 63% since the beginning of the year.
Also Read: Tensor Crypto Price Prediction 2025, 2026, and 2030
Tokens Similar to MYRIA and YTD Return
Here is a comparison of Myria crypto’s performance year-to-date against other similar tokens.
| Current Price | YTD Return | |
|---|---|---|
| MYRIA | $0.0007307 | -63.9% |
| NAKA | $0.3226 | -66.97% |
| BEAM | $0.0.006467 | -74.2% |
| SFUND | $0.5093 | -62.2% |
| PRIME | $3.01 | -76.0% |
| BIGTIME | $0.06397 | -53.1% |
Now, let’s take another look at EMT predictions based on analytical metrics from MACD, ATR, RSI, and Bollinger Bands.
MACD Earth Meta Crypto Price Prediction
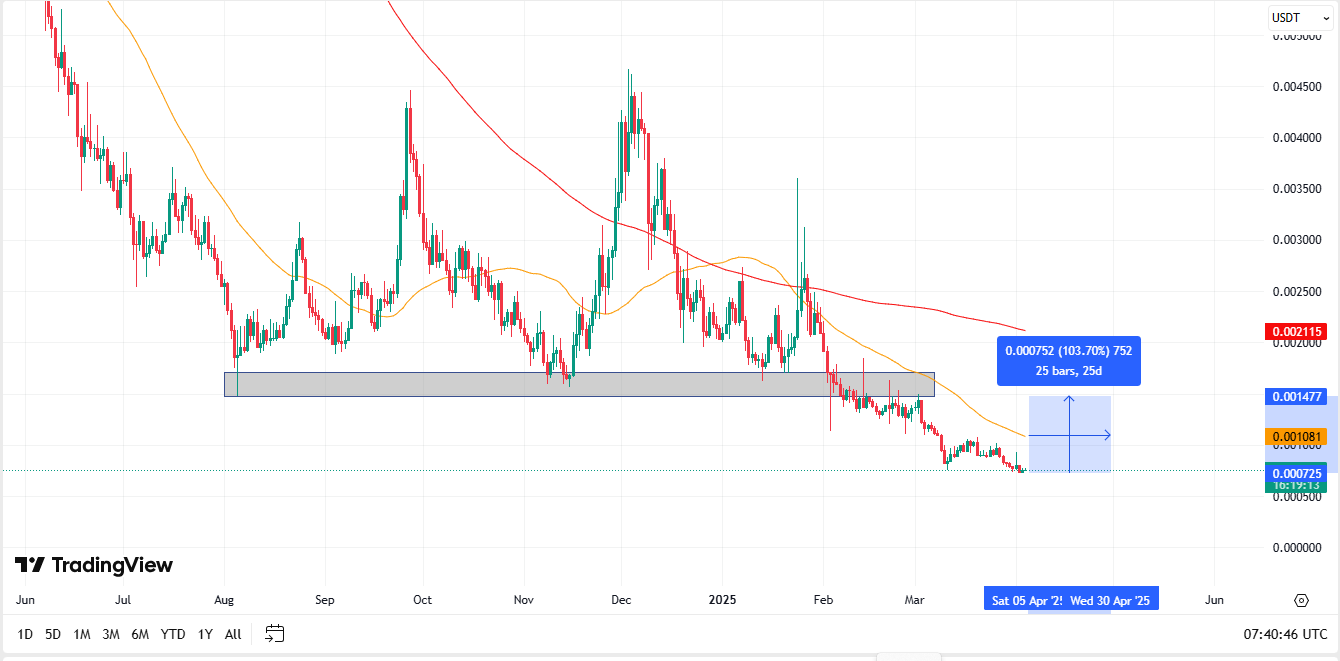
Moving Average Convergence Divergence (MACD) is a trend-following momentum indicator. It measures the relationship between two Moving Averages (the MACD line in blue and the Signal line in orange color) to find trends in the price of an asset.
When the MACD line crosses above the Signal line, it suggests a potential buying opportunity, while the MACD line crossing below the Signal line indicates a potential selling opportunity.
As of April 11, the MACD line was above the Signal line in the Myria daily chart, which indicates that the price is short-term bullish. However, the bars are tiny, which is indicative of a weak momentum to the upside.
RSI Myria Crypto Price Prediction
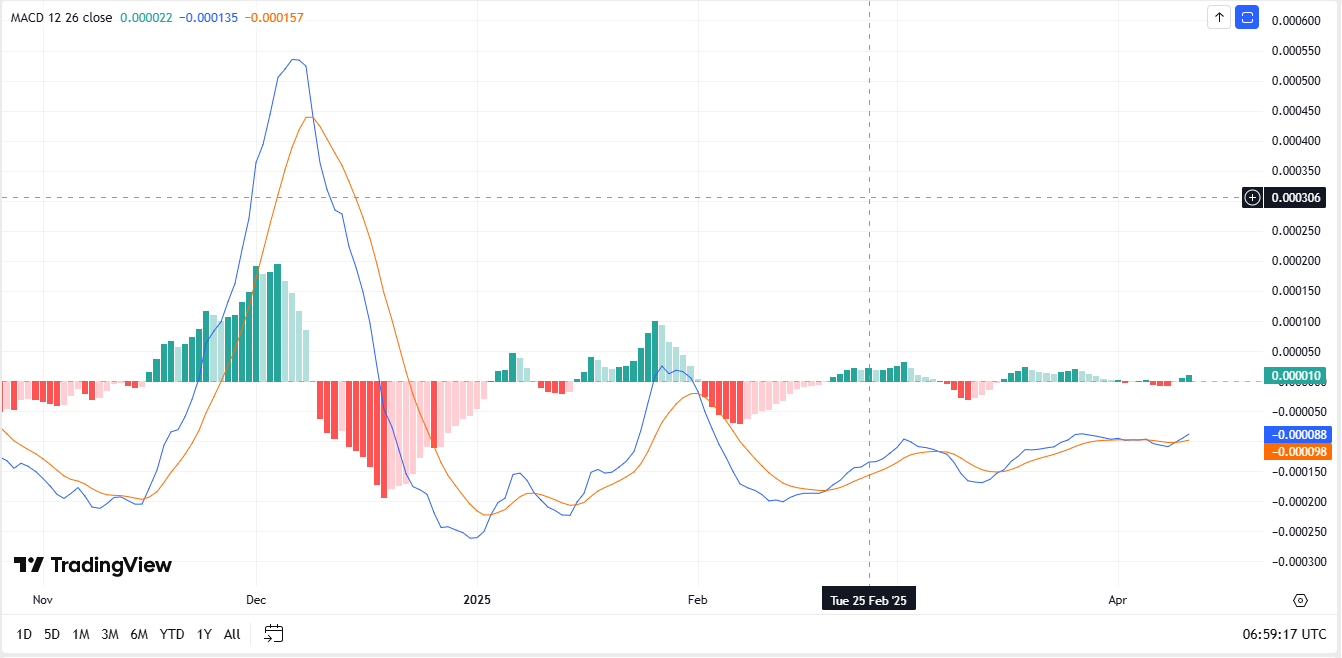
The Relative Strength Index (RSI) is a momentum oscillator that measures the speed and change of price movements. It’s primarily used to identify when an asset is overbought or oversold during market trends.
An RSI above 70 indicates overbought, suggesting a correction or pullback, whereas an RSI below 30 indicates oversold, suggesting an increase or reversal. The RSI above or below the 50 centerline indicates a bullish and bearish trend, respectively.
As of April 11, Myria crypto had an RSI value of 42.09. However, the RSI had formed a bullish divergence, which suggest a short-term price rally.
ATR Myria Crypto Price Prediction
The Average True Range (ATR) is a volatility indicator that measures the degree of price movement and the extent of price fluctuations over a specific period.
The True Range itself is calculated from three values: Current High minus Current Low; Current High minus Previous Close (absolute value); and Current Low minus Previous Close (absolute value). The ATR is the moving average of the True Range and it’s usually calculated over a 14-day period.
A high ATR value indicates greater volatility and larger price movements while a low ATR value indicates otherwise. However, in order to consistently compare volatility across different assets, we would need to normalize the ATR reading by dividing the ATR value by the asset price.
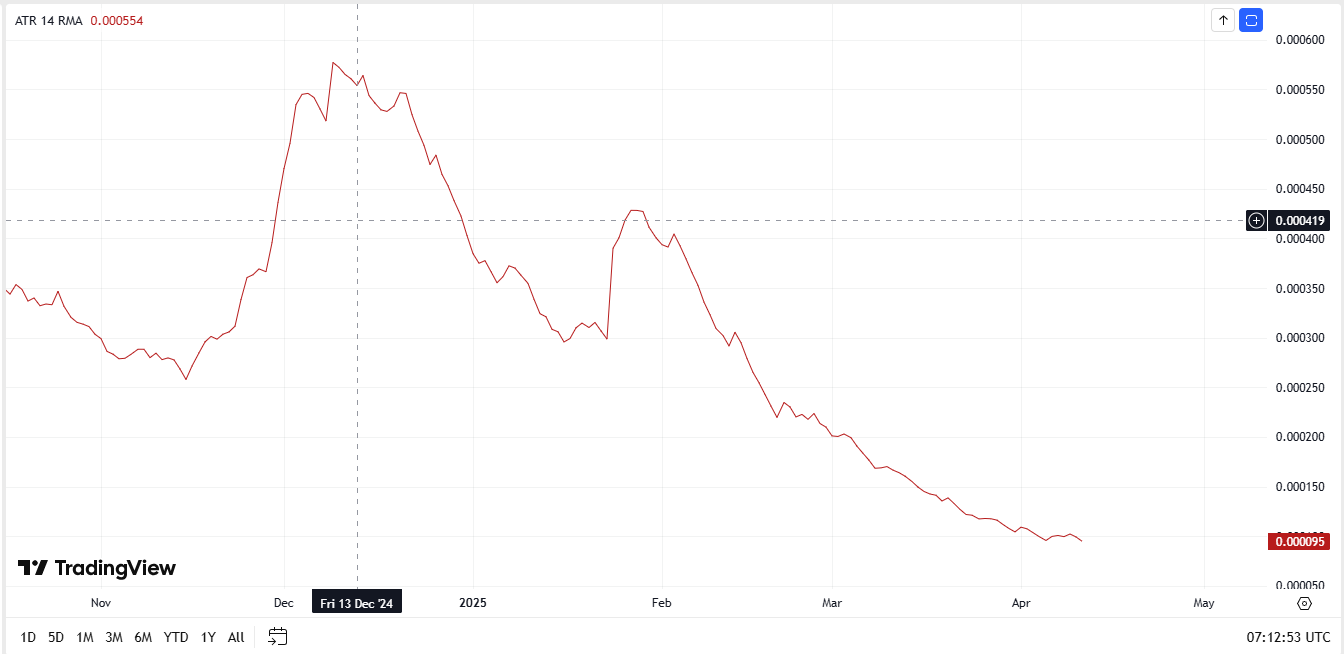
As of April 11, Myria crypto had an ATR value of 0.000095, with a normalized ATR value of 0.130137, which means that MYRIA is currently experiencing high volatility relative to its current value, meaning a higher potential for both profit and loss.
Bollinger Bands Myria Crypto Price Prediction
The Bollinger Bands measures both volatility and potential price targets where an asset may be overbought or oversold.
There are three important bands, the first is the Middle Band, which is a 20-period simple moving average (SMA) of the asset’s price and represents the average price over a specific period. The other two are the Upper and Lower Bands, which represent the upper range and lower range of potential price movements, respectively.
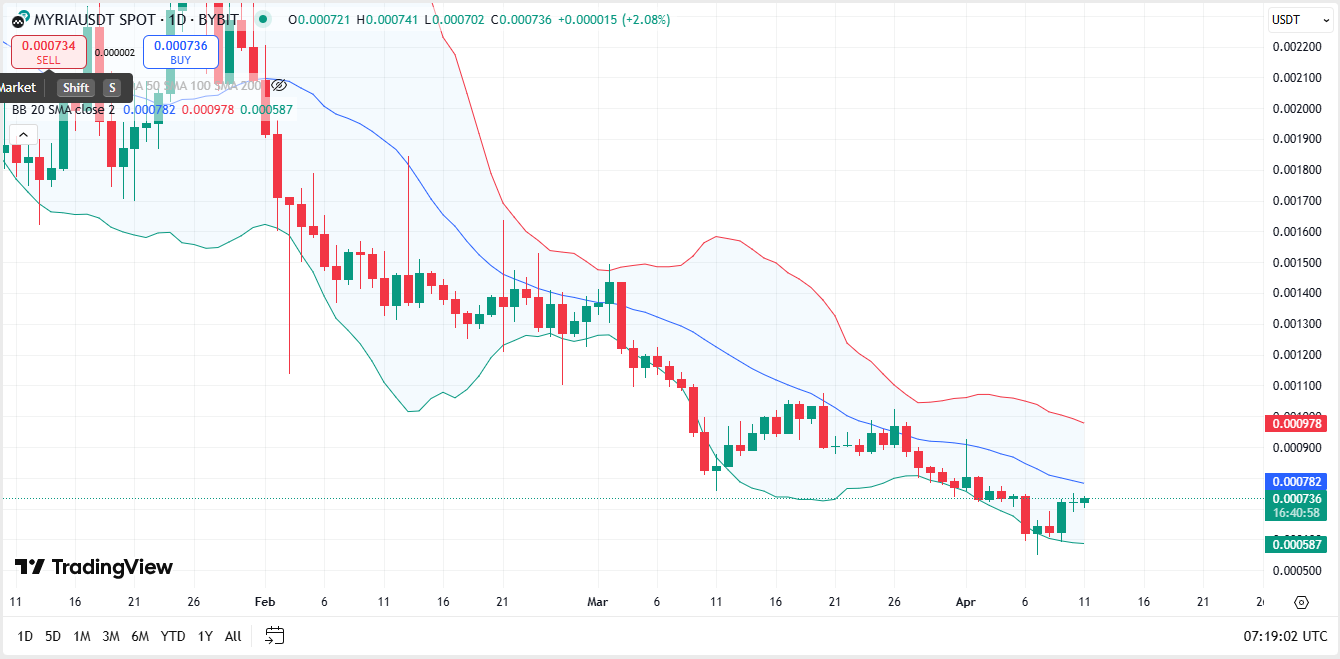
As of April 11, Myria was trending below the Middle Bnad. However, we could see that the price is currently pushing toward the upside after seeing a bounce on the Lower Band, a bullish move that tallies with other indicators.
MYRIA Crypto Community Sentiment
Platforms like Coinmarketcap conduct regular polls on community sentiment towards a token like MYRIA, especially on whether they expect the token to be bearish or bullish.

Based on Coinmarketcap data, MYRIA community sentiment, as of March 31, 2025, is 86% bullish (and 14% bearish).
Myria Crypto Fundamental Analysis
Our objective here is to analyze the market and technological developments of Myria to help you assess the intrinsic value of the project and its token so that you are able to decide whether MYRIA is a good investment.
What is Myria?
Myria is an Ethereum L2 scaling solution that leverages zero-knowledge technology to bundle thousands of L2 transactions into one single transaction in a highly secure and scalable environment. Thanks to the ecosystem’s STARK-based zkrollup solution, NFTs and dApps can achieve low transaction fees and unlimited scalability without compromising security.
Approximately 30.1B of the ecosystem’s maximum supply of 50B MYRIA is in circulation, with a fully diluted supply of $38.29M. Key features of the project include:
- A fully open-source and community-driven project
- Ethereum-level security sponsored by zk-STARKs
- Transparent and post-quantum secure – no trusted setup
- Instant withdrawal from the rollup back into Ethereum
- Low transaction fees
- Full ownership of assets, non-custodial architecture
- Anti-censorship quality
- Native support for core token types ERC-20 and ERC-721
- Simpler formal verification of contracts due to safe VM architecture
What is Myria Used For?
MYRIA is the native utility token of the Myria ecosystem, as it caters to blockchain gaming and NFT-related transactions. Several key uses of the token within the ecosystem include:
Developers and other end-users can process their protocol fees on the Myria network using the token. Also, users must use the native token when purchasing and operating Myria nodes, which are vital to the network’s processes.
The ecosystem also offers MYRIA to users as staking rewards to node operators and participants during staking activities. MYRIA is the exclusive token for NFT purchases within the ecosystem, while the game’s AAA selection flaunts in-game utilities that readily elevate the gaming experience to end users.
Distribution of Myria Token
MYRIA is distributed among ecosystem builders and contributors, node operators, and other participants to create a circular economy between all users. Here’s how the token’s distribution was allotted per the asset’s whitepaper:
Ecosystem Fund – 40%
Node Emissions – 36%
Team Project Development – 19%
TGE & Liquidity Provision – 3%
Strategic Reserve – 2.00%
All of its tokens are available for public sale on the community-focused ecosystem. As of March 31, 2025, Myria holds a total supply of 50 billion tokens, with about 39.4% (19.71 B tokens) unlocked.
Myria FAQs
What is the Myria Coin Used for?
The MYRIA token is the native utility of the Myria ecosystem, a web3 gaming platform. The token finds a wide range of applications on the ecosystem including protocol fee payments, exclusive NFT purchases, Myria nodes purchases/operations, staking rewards, and in-game utilities.
How much does Myria Nodes Cost?
Myria updated its node pricing in December 2023 to $5,500 per Node license.
Where can I buy Myria?
MYRIA trading occurs on centralized crypto exchanges like Bybit, MEXC, CoinDCX, BitMart, and Bitget.
Is Myria on Binance?
As of April 11, 2025, MYRIA is not listed on Binance for trading.
How does our Myria crypto price prediction work?
Myria crypto price prediction on Blockfinix is computed based on historical Myria data, referencing past volatility and market movements from available data.